Table of Contents
MotionScope
We wrote MotionScope after asking our physics teacher friends what tools they would like to have available to teach and/or study the concepts of projectile motion – concepts such as velocity, acceleration, momentum, and energy.
MotionScope uses Vizy’s camera to capture the motion of moving objects. It can accurately determine the position of each object in each frame by using image processing. It can then measure the velocity and acceleration of each object across each frame. This information is presented to the user via interactive graphs within their web browser. You can also download tables and spreadsheets containing the motion data for further analysis.
Like all of Vizy's applications, MotionScope is written in Python, source code is provided, and it can be customized.
Quickstart
To run MotionScope, click on the ☰ icon in the upper right corner and select Apps/Examples. Then scroll over to MotionScope in Apps, then click on Run.
Choose a well-lighted setting for your Vizy and orient it mostly level. Find an ordinary object – like a ball, but anything you can easily toss is good.
Camera setup
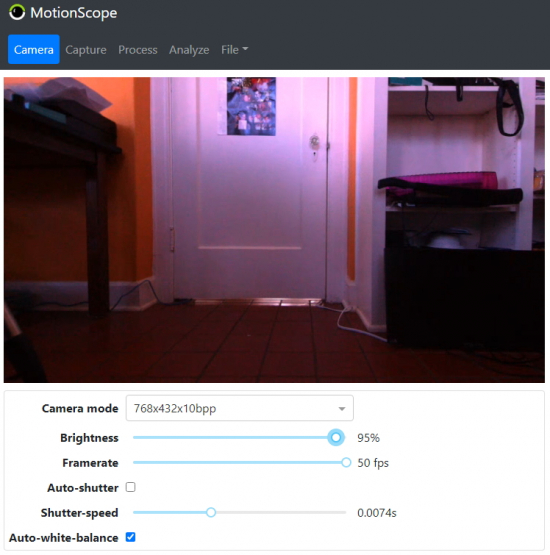
In general, you want to set the camera at a high framerate and low shutter speed to minimize motion blur, which can make it difficult for Vizy to accurately determine the position of your object(s) in each frame. However, lowering the shutter speed can create dark, underexposed images. You can counter this by increasing the brightness slider and/or using an environment that’s well-lighted.
Here's our recommended camera setup that minimizes motion blur:
- Choose 768x432x10bpp mode. This will provide the widest possible field of view.
- Turn off auto shutter by clicking on Auto-shutter.
- Choose a framerate of 50 fps.
- Adjust Shutter-speed to the lowest value possible while avoiding under-exposure (dark images).
- Increase Brightness to brighten the image if necessary. Avoid setting the brightness to more than 95%, which may introduce too much image noise.
Capturing footage
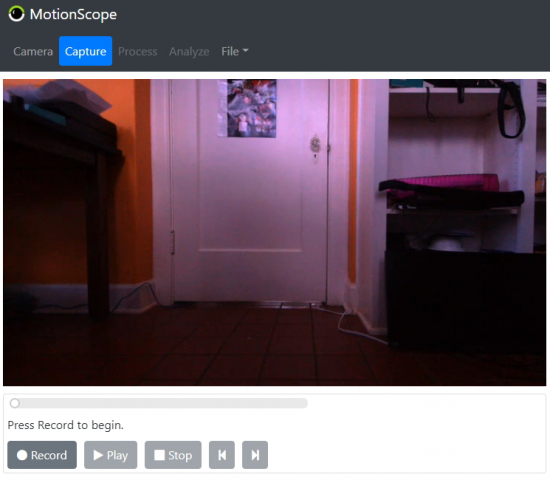
First, we need to capture footage of the motion we want to analyze. Click on the Capture tab.
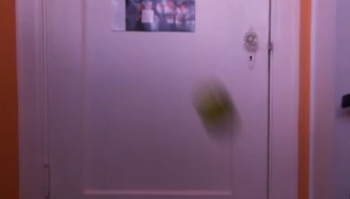
Press Record and toss the object in front of Vizy. Press Stop. Now examine the footage that you just took by pressing Play. You can pause the playback and look at individual frames by either grabbing the time slider or clicking on the prev/next frame buttons. For example, a blurry frame will look similar to this:
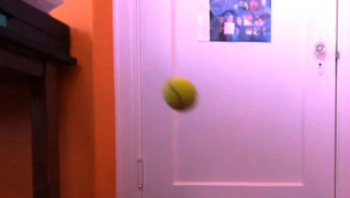
Here’s a decent frame. It has some motion blur, but not too much:
If your frame is blurry, go to the Camera tab and reduce the shutter-speed and increase the brightness if needed. Given the amount of light in the environment, it may not be possible to reduce the motion blur to acceptable levels while also maintaining image brightness. If this is the case you can either:
- Move the object farther away from Vizy’s lens. This will reduce the “image speed” (number of pixels traversed per second) of the object. For example, doubling the distance from Vizy will halve the image speed.
- Introduce more lighting into the environment. This will always improve motion blur by allowing you to reduce the shutter-speed.
Processing
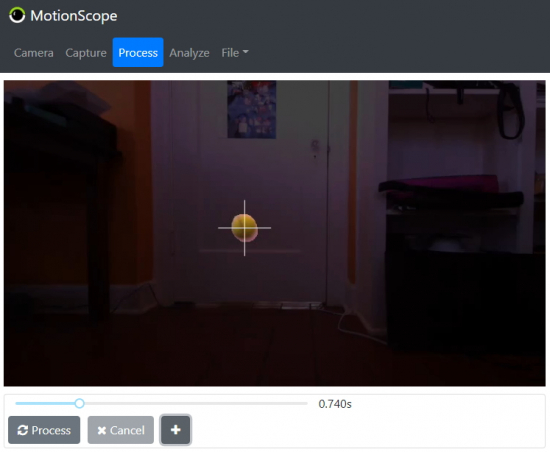
Now that you have footage without excessive motion blur, click on the Process tab. Vizy should automatically start processing the frames in an effort to find your object in each frame.
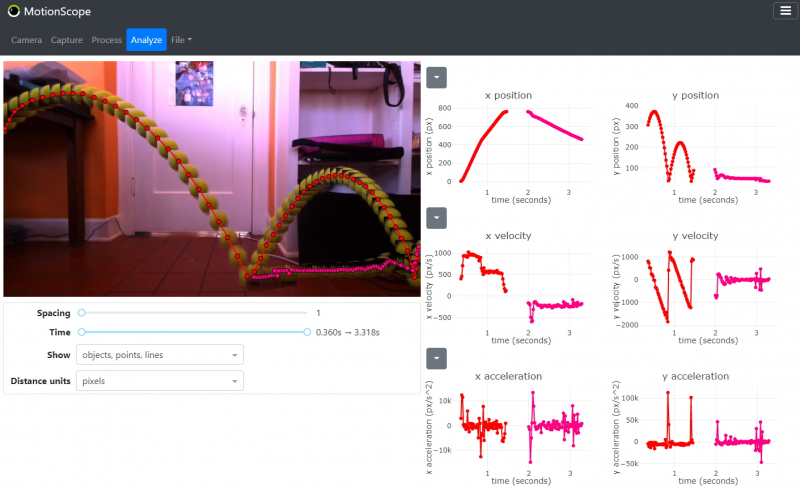
After it’s done, Vizy will automatically switch to the Analyze tab so you can see the motion of your object rendered in all its glory.
Analyzing
Show
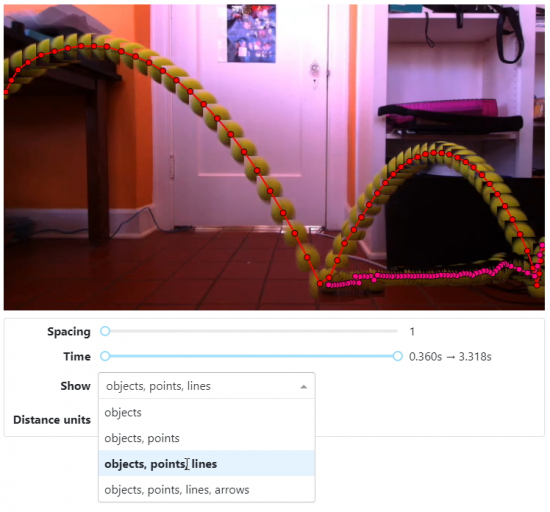
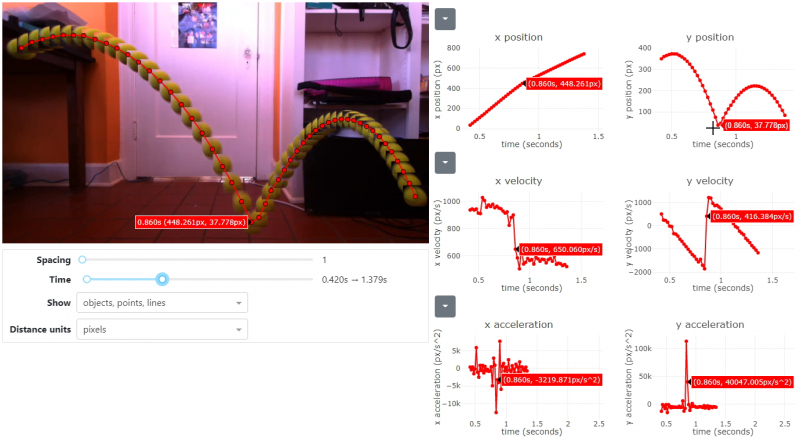
Let’s start by playing with the Show control. You can select whether you want to show just the objects or the objects with points, lines, and arrows. The points, lines, and arrows are drawn on top of the video.
Time
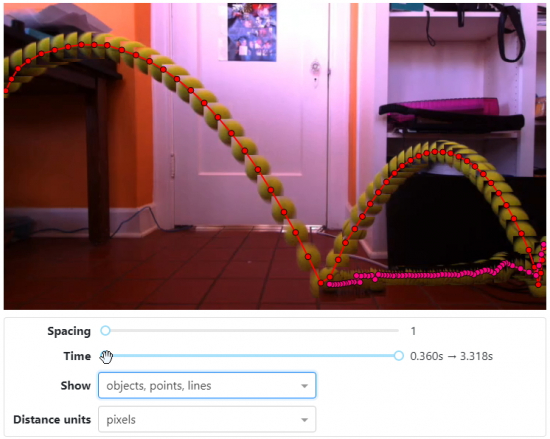
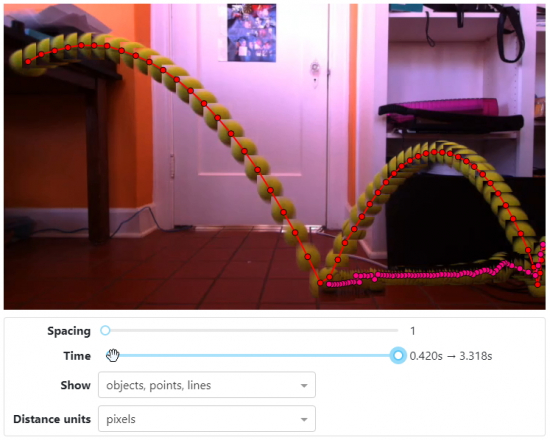
Oftentimes the beginning and end of the footage contain data that are inaccurate or unwanted. In our example, as the ball comes into the frame on the left, the data points are somewhat inaccurate because the ball is cropped by the edge of the frame.
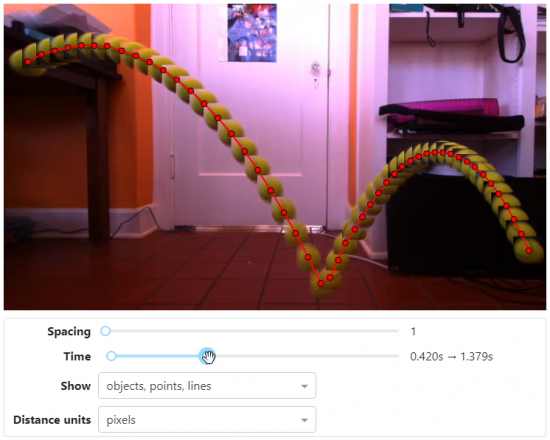
By adjusting the Time slider on the left we can remove these data points:
Similarly, the end of our footage has the ball rolling back into frame. We can remove these data points by adjusting the Time slider on the right:
Spacing
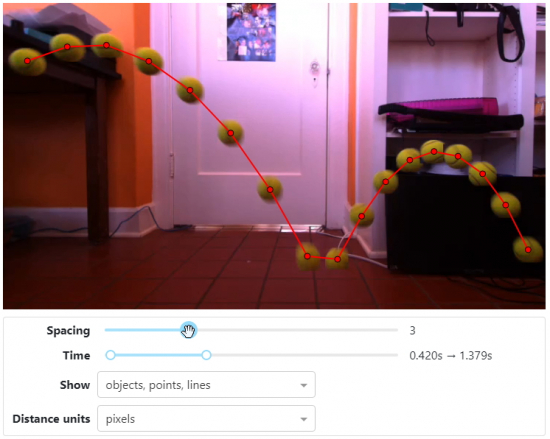
You can choose the spacing of the samples by adjusting the Spacing slider. By increasing the spacing, the velocity and acceleration measurements are averaged over longer periods of time, and measurement noise can be reduced.
Graph selection
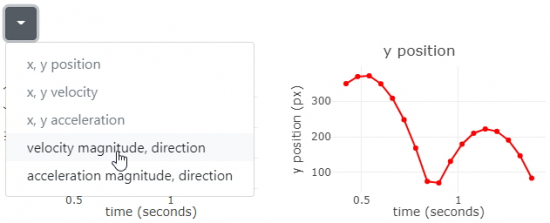
You can also choose the graphs you wish to view from the dropdown menu above each graph pair. Position, velocity, and acceleration graphs for x and y are chosen by default. Direction and magnitude graphs are available for velocity and acceleration.
Hovering
With your mouse pointer, hover over the data points either on the video or the graphs. You will see markers that will show you the same data points in the video and graphs. This is useful if you, for example, wanted to get the velocity and acceleration of a particular point.
Units and calibration
Vizy will present its results in pixel units. If you want the data that Vizy presents to be in different, more useful units such as meters, you will need to give Vizy a hint by telling it how many pixels there are in a meter.
Choose Meters in the Distance units selector. Then click on the Calibrate button that appears.
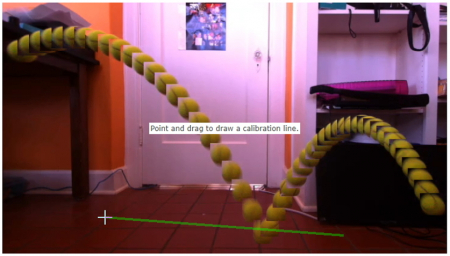
Using the mouse pointer, click and drag a line that equals 1 meter.
In our example, the tile on the floor provides markings that we can use to help draw a line that's 1 meter in length. Note, we should draw a line that's in the same plane of motion as our object(s). After drawing the calibration line, MotionScope will then present its data in meters, meters/second, etc.
Alternatively, you can choose different calibration distances other than 1 meter. You could choose 2 meters or 0.31 meters by changing the value in the text box. Or you could choose different units (centimeters, feet) by selecting them in Distance units.
Saving/loading
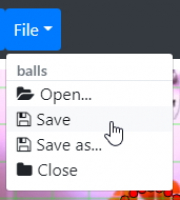
At any time can save your project to the SD card so you don’t lose your settings or data. The File menu has the familiar Open, Save, Save as…, and Close options.
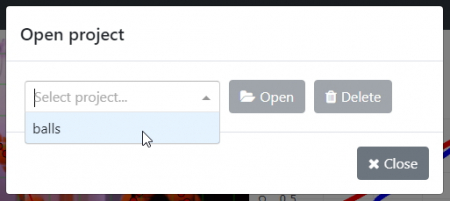
Note, that from the Open dialog, you can either open the project or delete the project, if you need to clean things up.
Importing, Exporting, and sharing MotionScope projects
Through the powers of the Internet (and Google Drive), you can export your MotionScope project and share with others. And they can import your project with its wonderful footage and data, which are zipped up and uploaded to Google Drive upon export.
Importing a project
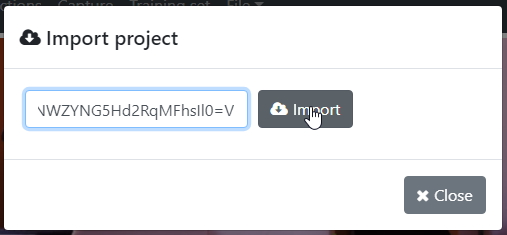
From the File menu select Import… to bring up the import dialog. Copy the share key into the text box and click the Import button. Vizy will then get busy downloading the zip file, unzipping, and installing the project. Easy! Note, you don't need to have Google services configured to import projects.
Below is a share key for our bouncing balls project. Copy and paste it to give it a try on your Vizy!
VWyJNU1BHIiwgImJvdW5jaW5nIGJhbGxzIiwgIjE3QlRCdWhHRmg3Q2FhXzRwU3NzNWhxUkE5Y182cV9taiJdV
Exporting a project
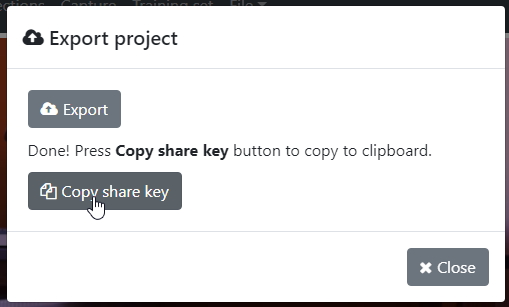
From the File menu select Export to bring up the export dialog. Click the Export button. Vizy will then get busy zipping up the project and copying it to Google Drive. When it's finished it will present you will a Copy share key button.
Pressing this will copy the “share key” to your clipboard. The share key is just a jumble of text. You can save the key to a text file, email it, etc. With this key, someone can import your project.
Expert Capture Settings
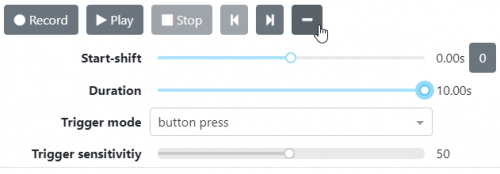
Capturing the motion can sometimes be challenging. For example, it's easy to press Record in your browser window too late or too early. MotionScope has some settings that can make capturing footage more reliable. You can access these settings by pressing the + button in the Capture tab.
Trigger mode
There are several different ways to trigger a recording in MotionScope.
- button press is the default trigger mode. In this mode, you can either click
Recordin theCapturetab or you can physically press Vizy's button (you know, the one on top of Vizy.) - motion trigger will wait for motion in the camera image to trigger a recording. You can set the sensitivity of the motion detection with the
Trigger sensitivityslider – the higher the sensitivity, the less motion required to trigger a recording. - external trigger allows you to use an external remote trigger commonly used in photography (either wired or wireless). You simply short pin B0 on the I/O port to Ground.
Start-shift
The Start-shift slider allows you to capture video footage before you trigger the recording (or after). For example, a start-shift of -1s (negative 1 second) would buffer 1 second of footage before you press Record (assuming trigger mode is set to button press).
This helps make sure that you don't miss important footage. Alternatively, if start-shift is 1s (positive 1 second), recording will start 1 second after you press Record.
Additional notes:
- You can use any trigger mode with
start-shift.Motion triggercombined with a small negative start-shift value (e.g. -0.2s) can be particularly useful, as the motion detection may lag several frames with respect to the desired beginning of the footage. - Pressing the
0button resets start-shift back to 0.
Duration
Setting the duration via the Duration slider will automatically stop the recording at the specified duration.
Exporting data
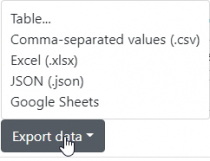
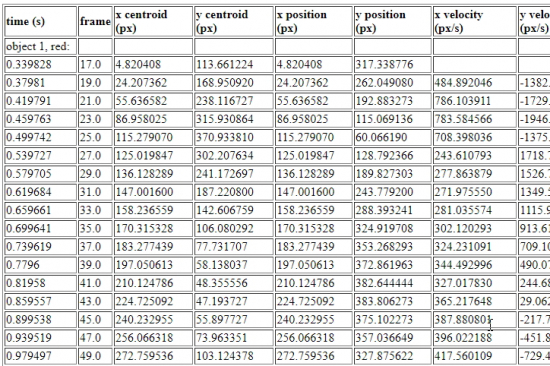
MotionScope provides plots of the motion data for easy visualization, but sometimes you want the raw numbers. At the bottom of the Analyze tab is the dropdown menu Export data.
Note, Google Sheets will only be enabled if you've configured your Vizy for Google Cloud. Selecting one of these types will either download the data file or display it in a separate browser tab.
Note, whatever data is displayed within MotionScopes graphs in the Analyze tab is what is exported. If you want all data points to be exported, be sure to set the Spacing slider to 1.
Changing camera perspective
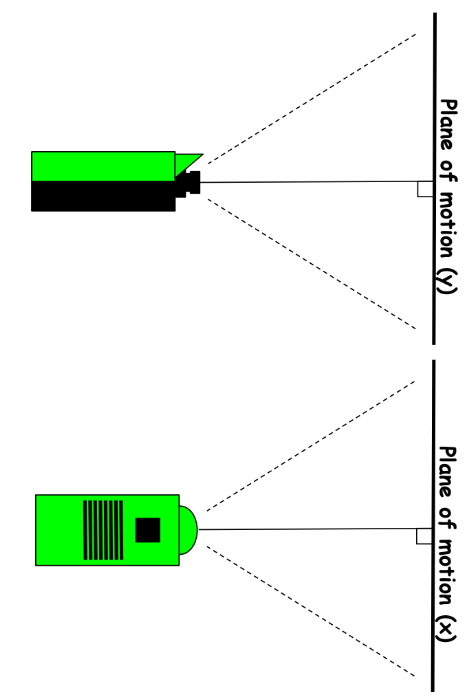
MotionScope works best with any motion that’s parallel to Vizy's camera sensor (aka the image plane). Motion that’s coming toward or moving away from Vizy will not be fully captured.
To visualize this, imagine Vizy looking at a wall straight-on. Any motion that’s moving parallel to the wall will be captured. Refer to the figure below and the “plane of motion”. Note: the distance from Vizy doesn't matter, just the angle of the motion.
For example, motion directed 45 degrees with respect to the wall won't be fully captured. About 70% of the motion will be captured, 30% will be lost. (Cosine of 45 degrees is 0.7071 or ~70%.) Many times we can't position Vizy such that its image plane is parallel to the motion. For example, imagine capturing the motion of a ball falling from a building. Here, we typically can only position the camera on the ground, so in order to capture the motion, we necessarily need to point Vizy up at an angle (not parallel to the motion – doh! But we deal with this problem in the next section.)
Capturing non-parallel motion (homography to the rescue!)
Homography allows us to transform Vizy's camera images such that a chosen plane in the environment is effectively parallel to Vizy's image plane. The Perspective control uses homography to calculate a new plane of motion and effectively recover any non-parallel motion. (Think of each combination of Perspective controls as selecting a different plane in the environment – with it we can select any practical plane of motion.)
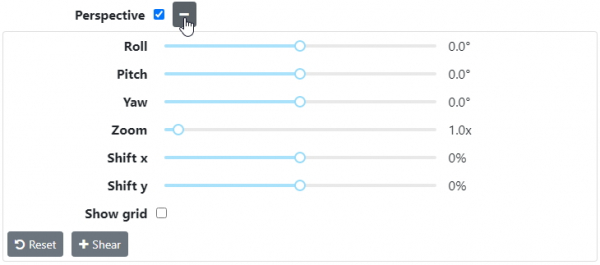
The Perspective controls are shown below. Click on the checkbox to enable it and then click on the + icon to reveal.
These controls are fairly self-explanatory – adjusting the controls changes the perspective of the live camera view. The Shear controls are used less often, which is why they aren't normally displayed.
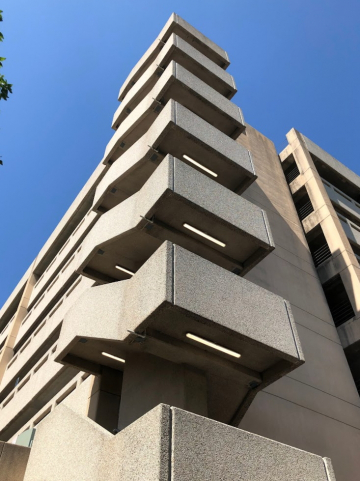
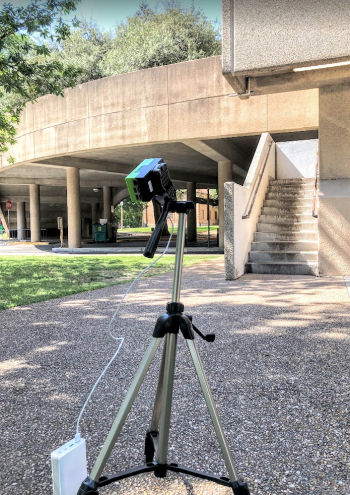
Back to the “ball falling from a building” example, or in our case, ball falling from a parking garage: Vizy is pointed up at an angle to capture the motion of the ball as it falls. Vizy is rotated 90 degrees to capture more of the vertical motion – check out the picture of Vizy below (Vizy is rotated on its side and looking up). Note also, it's hooked up to a portable charger for power.
We can adjust the perspective controls during analysis within the Analyze tab. Note, how the sides of the parking garage stairwell become parallel – it's as if we're looking at the plane of motion head-on instead of up at an angle. Note also that we enable the Show grid overlay so we can line things up more easily (vertical lines should be parallel with respect to each other and the y axis.)
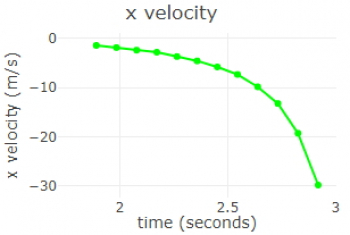
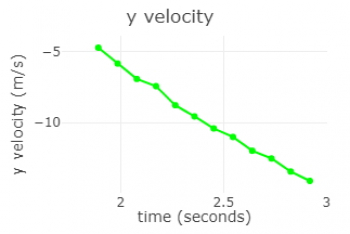
Before we adjust the perspective the x velocity graph is curved, but after the perspective is corrected, the y velocity graph becomes a straight line, which is what you'd expect from an object experiencing constant acceleration. (Not to confuse things, but the x velocity graph essentially becomes the y velocity graph after we rotate (roll) the perspective 90 degrees, hoo boy, this was supposed to be a simple example…)
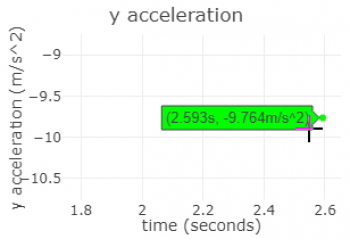
By changing the camera perspective in this way, we are able to accurately measure the acceleration of the ball at close to 9.8 m/s2
, although given the nature of acceleration (a double time-derivative of position) we need to average over lots of measurements to reduce the noise introduced by differentiation – below, we adjusted the Spacing so that we averaged over all measurement points to get the overall average acceleration.
For arbitrary yaw and pitch angles, you can use a “calibration grid” of squares in the image such that it's oriented parallel with the plane of motion. With such a grid in the environment, you can make sure that you capture both the correct perspective and calibration information. When you've corrected the perspective, you're presented with an image of squares that are parallel with the grid overlay. (Yay tomography!)
Motion extraction
MotionScope is able to extract motion by using the simple technique of frame differencing. That is, MotionScope creates a background image and then subtracts this image from all frames in the sequence. It then performs thresholding on the frame differences. If the difference exceeds a threshold, it’s assumed that there was motion in that part of the frame.
Adjusting the motion threshold
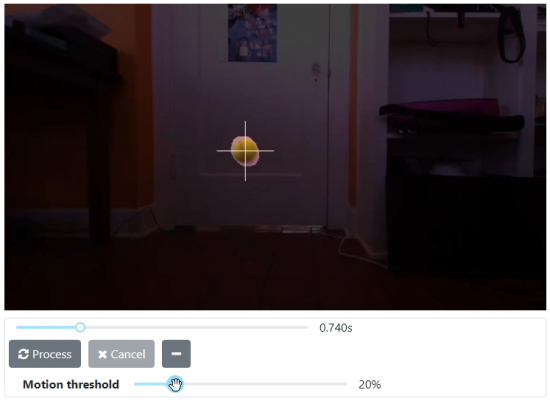
In the Process tab, if you click on the + button, the Motion threshold slider is revealed. You can seek to any part of the video with the time slider, and it will show you which parts of the image will be considered to be in motion. You can adjust the Motion threshold slider to find a good threshold that captures the motion you want.
Changing the motion extracting algorithm
For advanced users who don’t mind doing some Python programming, you can customize MotionScope’s motion extraction algorithm to better fit your needs. For example, if you wanted to track the motion of a trebuchet, you'd likely want to use visual clues other than motion (e.g. hue, structure) to extract the motion of only the payload as it's gaining speed and being flung. Check out simplemotion.py in the source directory (/home/pi/vizy/apps/motionscope).

